Visual Capitalist, September 15, 2026
Key Takeaways
Shale Crescent USA ranks #1 among U.S. producing regions and #2 when compared to other nations.
Appalachia (Shale Crescent USA) produces more natural gas than major countries including Iran, China, Canada, and Qatar.
Abundant natural gas can provide manufacturers with long-term energy and operational advantages.
Natural gas production shapes industrial competitiveness around the world.
Regions with abundant, reliable energy often attract manufacturers, power generators, and other energy-intensive operations seeking long-term cost and competitive advantages.
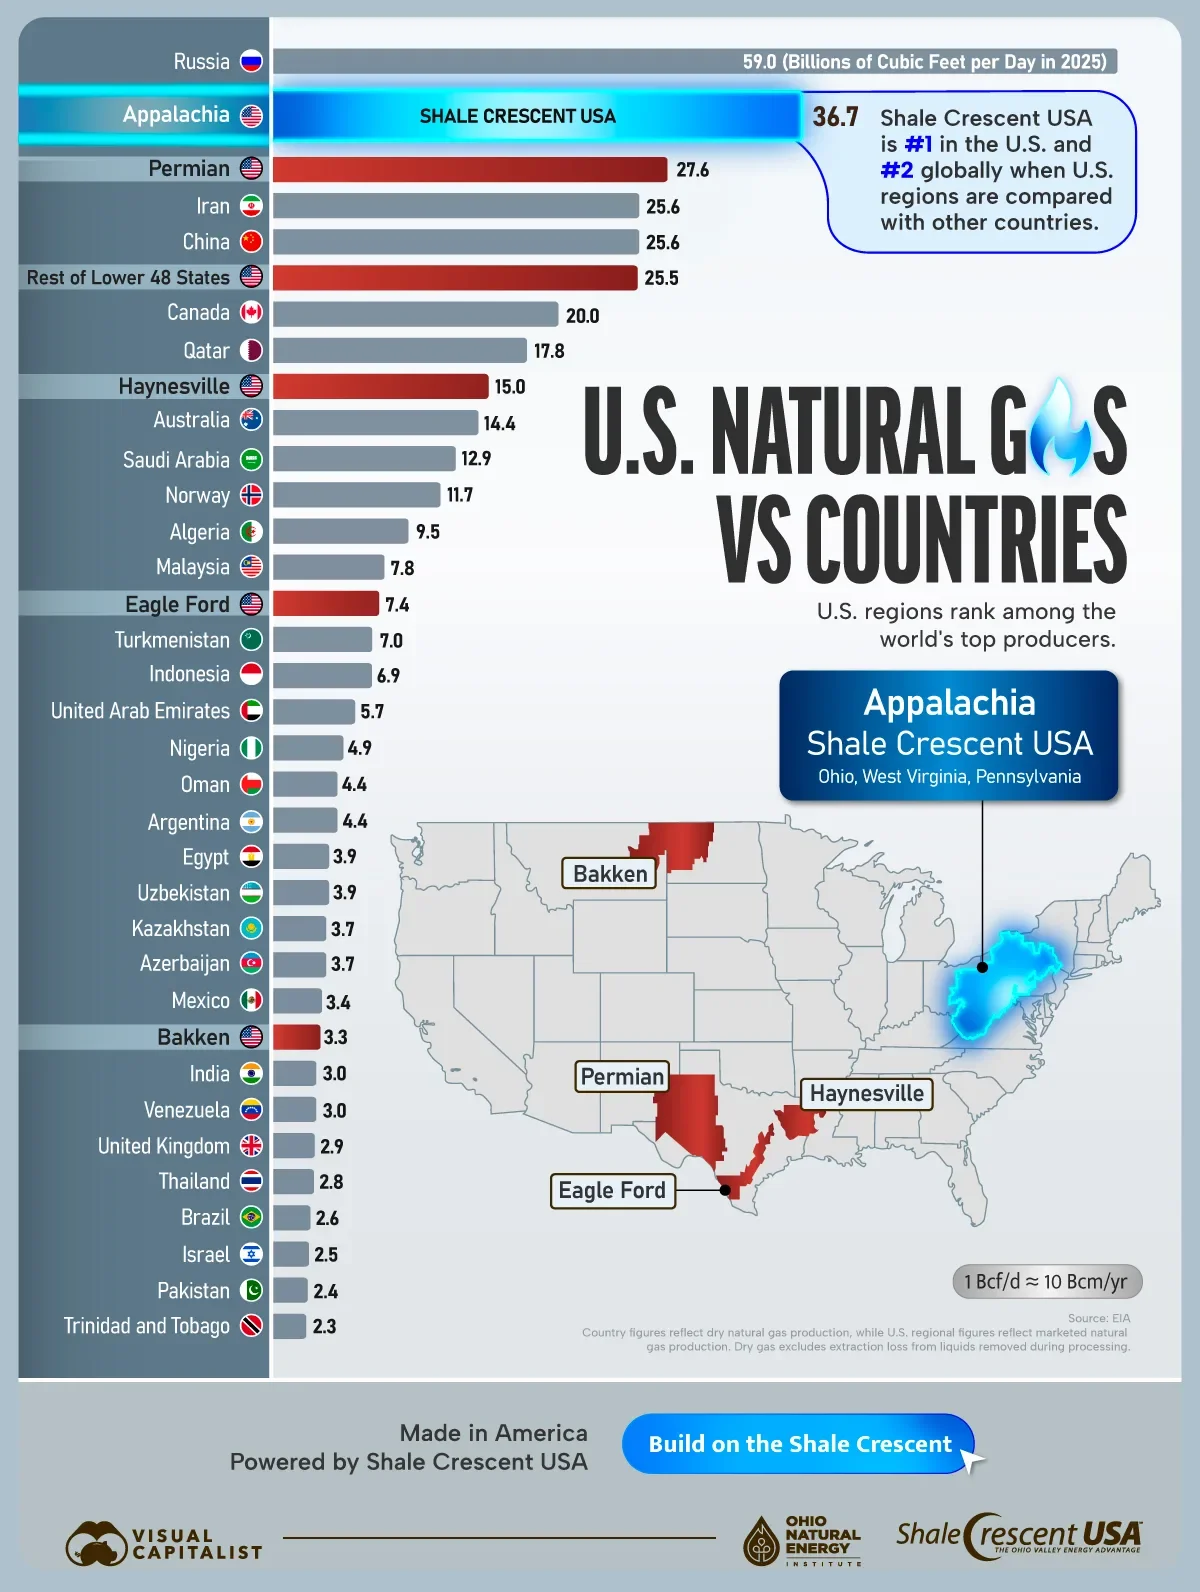
This graphic, in partnership with Shale Crescent USA, shows how major U.S. natural gas-producing regions compare against entire countries using data from the U.S. Energy Information Administration (EIA) and the Energy Institute.
U.S. Regions Compete on a Global Stage
The United States already leads the world in natural gas production. However, several U.S. producing regions rival major energy-producing nations on their own.
Here is a table that shows natural gas production across leading countries and major U.S. producing regions.
Rank Country/Region Natural Gas Production in 2025 (Bcf/d)
1 🇷🇺 Russia 59.0
2 🇺🇸 Shale Crescent USA 36.7
3 🇺🇸 Permian 27.6
4 🇮🇷 Iran 25.6
5 🇨🇳 China 25.6
6 🇺🇸 Rest of Lower 48 States 25.5
7 🇨🇦 Canada 20.0
8 🇶🇦 Qatar 17.8
9 🇺🇸 Haynesville 15.0
10 🇦🇺 Australia 14.4
11 🇸🇦 Saudi Arabia 12.9
12 🇳🇴 Norway 11.7
13 🇩🇿 Algeria 9.5
14 🇲🇾 Malaysia 7.8
15 🇺🇸 Eagle Ford 7.4
16 🇹🇲 Turkmenistan 7.0
17 🇮🇩 Indonesia 6.9
18 🇦🇪 United Arab Emirates 5.7
19 🇳🇬 Nigeria 4.9
20 🇴🇲 Oman 4.4
21 🇦🇷 Argentina 4.4
22 🇪🇬 Egypt 3.9
23 🇺🇿 Uzbekistan 3.9
24 🇰🇿 Kazakhstan 3.7
25 🇦🇿 Azerbaijan 3.7
26 🇲🇽 Mexico 3.4
27 🇺🇸 Bakken 3.3
28 🇮🇳 India 3.0
29 🇻🇪 Venezuela 3.0
30 🇬🇧 United Kingdom 2.9
31 🇹🇭 Thailand 2.8
32 🇧🇷 Brazil 2.6
33 🇮🇱 Israel 2.5
34 🇵🇰 Pakistan 2.4
35 🇹🇹 Trinidad and Tobago 2.3
Russia leads all countries outside the U.S., producing 59.0 Bcf/d in 2025. However, with 36.6 Bcf/d, the U.S. region of Appalachia (Shale Crescent USA) substantially leads the runner-up nation of Iran.
Appalachia also leads major natural gas-producing countries such as China, Canada, and Qatar.
Why the Shale Crescent Stands Out
Shale Crescent USA encompasses Ohio, West Virginia, and Pennsylvania, an area that is geographically half the size of Texas and has become one of the world’s most important natural gas-producing hubs.
Its scale creates advantages beyond energy production. Businesses located near abundant natural gas can benefit from reliable supply, reduced transportation costs, and access to a critical industrial feedstock.
The data demonstrates that Shale Crescent USA is not simply a leading U.S. region—it is a globally significant energy producer.
Consequently, manufacturers evaluating new locations may find the region’s combination of scale, reliability, security, and resource availability particularly compelling for their long-term goals.